When it comes to the question of categorizing some of the standard analysis methods in the field of safety and risk engineering, one of the illustration that I use are the two “axes of knowledge”:
- the knowledge about the causes and
- the knowledge about the consequences.
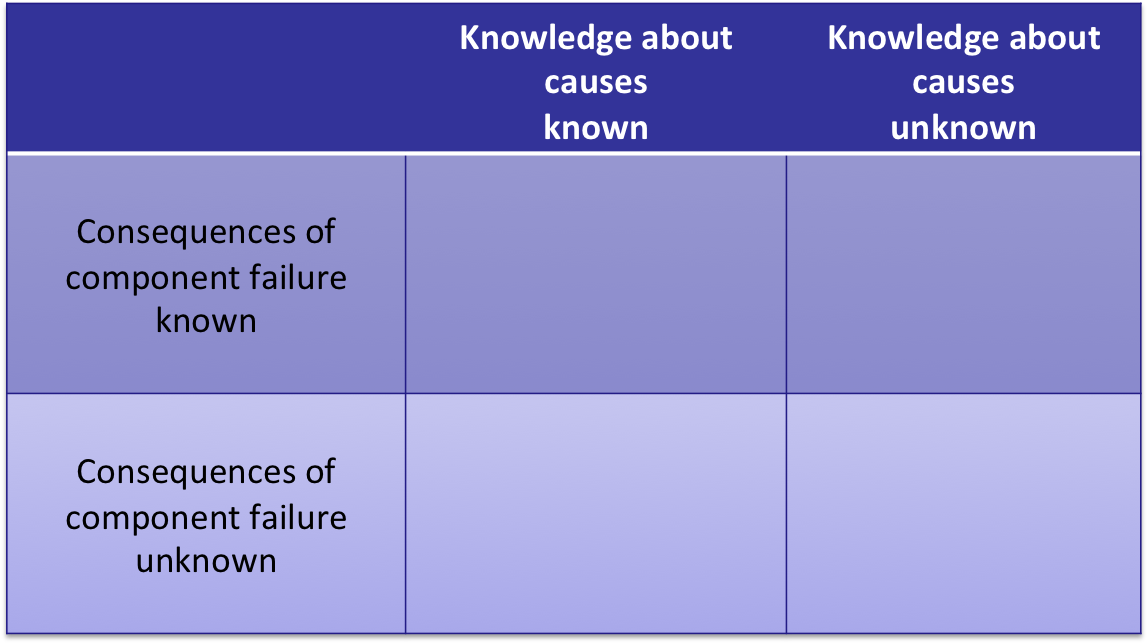
Figure 1: Matrix of Fault Analyses, empty
If for both axes we consider just the two values “known” and “unknown”, the resulting matrix looks like shown in figure 1:
Each of the four fields has its specific meaning, dependent on the values of the axes:
- If we have full knowledge on the possible failure causes in the system and also fully understand their consequences on the system behaviour, we don’t need to do any further analysis. It is just a description of the system behavior.
- If we know which components in the system might fail and in what way, but don’t know yet how these faults will affect the system behavior, the standard method to apply is the Fault Mode and Effect Analysis, FMEA. Often performed in lengthy meetings with system experts from various disciplines, for each individual fault the potential consequences in the local meighborhood and/or the global system outcome is analyzed. Since the analysis direction more or less follows the assumed causality, the FMEA is an inductive analysis.
- If however, we have good knowledge on possible system failures on top-level – often expressed as undesired hazards – and the task is to identify potential root-causes in lower level items (technical components, process steps, …), one of the standard methods is the Fault Tree Analysis, FTA. The reasoning here is typically against the assumed causality in the system’s functionality, so the FTA is a deductive analysis form.
- If there is neither good knowledge on the possible faults nor on the undesired outcome on toplevel, the analysis has to be performed in an explorative way, i.e. to investigate and acquire knowledge in both of the axes simultaneously. A so-called HAZard and OPerability study, HAZOP, could be the method to choose in this case. Here you systematically look at certain process quantities and analyzing how their deviations in various ways would affect the system performance.

Figure 2: Matrix of Fault Analyses, filled in
So the resulting matrix of fault analyses looks as shown in figure 2. More information on the mentioned methods you will find behind the links.
Later posts will investigate these methods in more detail, especially how they might be supported by tools and virtual system models. Feel free to subscribe to the mailing list to get updates right into your mailbox!